

Ethereum is trading at $2,255.04 in April 2026, up 7.09% on the monthly chart, after the $2,017.09 monthly low tested and held the ascending support trendline connecting Ethereum’s major lows since 2019. The monthly MACD histogram has turned positive at 129.89, marking the first constructive macro momentum signal since the late 2025 decline from the峰值 4,800 美元。
- Ethereum price is at $2,255.04 in April 2026, up 7.09% on the monthly chart, after the $2,017.09 monthly low tested the ascending support trendline visible on the OKX monthly chart since 2019.
- The monthly MACD (12,26,9) histogram reads a positive 129.89, with the MACD line at -29.45 trading above the signal at -159.35, confirming improving macro momentum at the trendline test.
- The immediate bull case targets the SMA 50 at $2,440.86; a monthly close below $2,017 breaks the trendline and exposes $1,500 as the next structural reference.
Ethereum (ETH) price is at $2,255.04 in April 2026, up 7.09% on the monthly close, after the monthly low of $2,017.09 tested and held the ascending support trendline annotated on the chart connecting Ethereum’s lows from the 2019 base through the current cycle. Both SMAs remain overhead: the SMA 50 at $2,440.86 is the nearest resistance and the SMA 20 at $2,857.71 is further above. The April monthly candle is printing a long lower wick at the trendline, a candlestick structure that historically signals demand absorption at a structurally significant level.
Multiyear Trendline Holds as Monthly MACD Histogram Turns Positive
The ascending support trendline on the monthly chart connects Ethereum’s bear market lows in 2019, the 2020 pre-rally base, and the 2022 cycle bottom, making this the deepest and most tested structural level on Ethereum’s price history. The $2,017.09 monthly wick is the most significant test of that trendline in the current correction, and it has held without a monthly close below it.此后价格已恢复至 2,255 美元区域,在趋势线上方形成积极的月度实体。
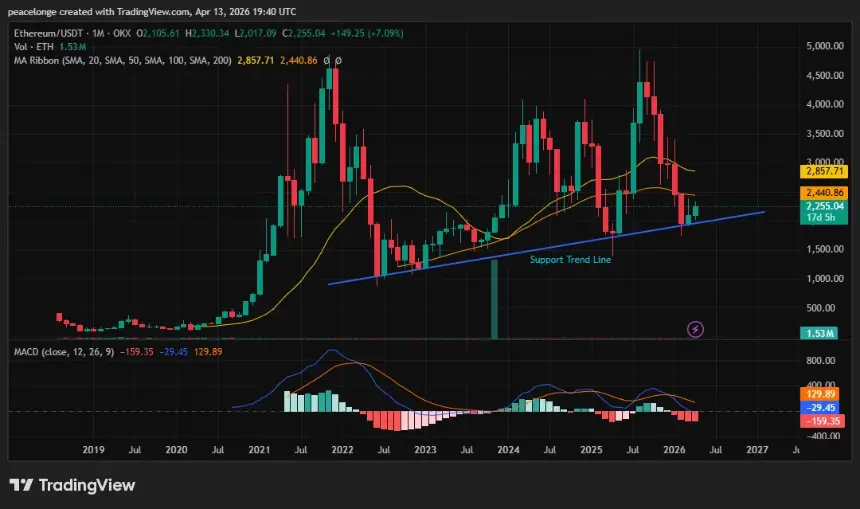
The monthly MACD (12,26,9) provides the critical secondary signal. The MACD line at -29.45 is now 129.89 points above the signal at -159.35, producing a positive histogram. While both lines remain in negative territory, indicating the macro trend has not reversed, a histogram turning positive at a multiyear trendline test is consistent with momentum inflecting before price does on the longer timeframe. This is the first positive monthly histogram reading since Ethereum’s descent accelerated from its August 2025 high near $4,800.
Crypto analyst Leshka wrote on X that ETH “will 3x-4x in the next six months,” pointing to a supply squeeze developing on centralized exchanges as evidence of a structural base forming at the trendline level, a view that gains more technical grounding with the monthly MACD now confirming improving momentum.
关键水平:支撑位、阻力位和价格目标
The multiyear ascending trendline, currently intersecting around $2,000 to $2,100, is the structural floor on a monthly closing basis. The $2,017.09 monthly low is the concrete level to hold: a monthly close below it breaks the trendline and exposes $1,500, which aligns with the 2023 accumulation zone and represents the last major demand area before untested territory.
On the upside, the SMA 50 at $2,440.86 is the immediate recovery target.月度收盘价高于该水平将使移动平均线从完全看跌转变为开始恢复移动平均线结构。 20 移动平均线 (SMA) 2,857.71 美元是扩展目标,代表着回到 2025 年崩溃之前两条移动平均线 (SMA) 聚合的位置。
Invalidation: a monthly close below $2,017.
链上和市场数据背景
Perpetual futures on Ethereum showed a slightly positive funding rate as of April 12, indicating measured but persistent long-side demand is returning. The Ethereum Foundation staked 45,000 ETH on April 5, nearing a target of 70,000 ETH, reducing immediate circulating sell pressure while generating an estimated $3.9 to $5.4 million annually in yield. Whales withdrew over 120,000 ETH from centralized exchanges in early March, the largest outflow since October 2025, per CryptoQuant contributor Arab Chain, a pattern consistent with accumulation near structural support.
Upgrade Pipeline Provides Forward Catalyst
Ethereum’s Glamsterdam upgrade, scheduled for H1 2026, targets a significant increase in the gas limit, parallel transaction execution, and enshrined proposer-builder separation. The upgrade continues the scalability work started by the Fusaka hard fork and is expected to materially reduce Layer-2 transaction costs, strengthening the fundamental case for ETH at current prices.
If Ethereum holds the multiyear trendline on a monthly close basis and the MACD histogram continues to expand, the SMA 50 at $2,440 is the first recovery target, with the SMA 20 at $2,857 as the extended bull case.月度收盘价低于 2,017 美元,突破趋势线,宏观结构转为看跌。